On Print | Measuring Print Quality Within and Across Platforms
- Published: February 20, 2014, By Dr. Dene Taylor
 “If you can’t measure it, you can’t control it” is a basic manufacturing axiom, applied to many components of a modern printing facility. But when it comes to print appearance, only the density of primary colors over a range of screen levels is tracked numerically, although registration is mostly by closed loop control.
Skin tone, mottle, resolution, and shade rendition typically are evaluated subjectively. They all can be measured, but I’ve seldom before seen them outside an academic institute or industry laboratory department where the focus is on development or release of a press, not print production.
Fortunately, in-process control is seldom an issue—once set up and running, changes have causes that can be addressed. People associated with the traditional technologies have a huge amount of accumulated experience about machine, ink, and substrate. There is more of an issue in establishing set ups and maintaining them from run to run or machine to machine. That is when measured differences can have a greater impact on reactions leading to permanent improvement.
Digital printing has additional reason for print quality analysis. Unlike flexography, offset, and gravure, where production lines often print the same type of image on more or less the same substrate for a few customers, there are many clients with different outcomes on different substrates for different applications. Inadequate performance is soon recognized, but adding cost by running to excessive standards is not. Secondly, there are so many adjustable factors available, most are left at factory settings, even when the ink, substrate, and application are all different.
Even OEM specialists seldom know the best combination of settings for more than a few combinations—it is a considerable job to balance the conflicting demands for even one—so stepping out of the box is uncharted territory.
It doesn’t have to be so difficult. At the CPP–PFFC Conference Program co-located with Print 13, Henry Freedman of Technology Watch described a print quality measurement service from Image Test Labs available to anyone who can print a page-size PDF file. Like other analytical files, it contains a series of elements and images representing the most important features that correlate with print quality.
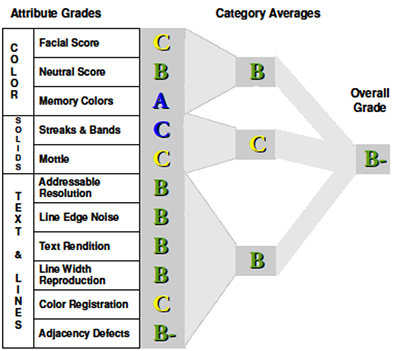
For example, there are skin tones, defined solids, gray scales, and registration bars at many angles. The print is shipped to Image Test Labs and undergoes a series of print measurements from which comes a score card with ratings for 11 separate parameters (see Figure 1). These are combined into a score for the print reflecting the performance of the press at that time. Furthermore, by running structured experiments, the effects of key parameters on press performance can be obtained—something extremely difficult if assessment is subjective.

The rating is an absolute value—from A+ for the highest level to F for the lowest. Rating is relative though—not all prints have to be full visual gamut with perfect image reproduction and 3-point type. Different applications have their own sets of appropriate values—eventually for a continuing user, this means target and acceptable range. Retail consumer goods labels are distinct from wine labels, OTC packaging from wine boxes, and so on. This has not yet been established, but we can expect it in due course.
The score card also shows the print score in a histogram relative to the scores of comparable devices previously analyzed. Although anonymous, it is obviously of value to appreciate performance relative to your peers. But that is not all. Here are more benefits and uses.
- Assure the quality of your printing device by providing a standard target showing detail of the output device measured on the actual material being printed on.
- Assess quality of the rip in combination with the output device.
- Allows you to see the behavior of the output device using different types of paper and stock materials.
- Interrogates the RIP to determine the RIP's profile—basically a snapshot of the RIP info.
- Helps communicate service issues with the manufacturer of your RIP as well as the output device.
- Evaluates various settings for digital output—density, screening, resolution. An instant gauge to evaluate different settings.
- Allows monitoring of performance of device over time—comparisons between days, weeks, months, etc.
- Standardizes the way to measure across different platforms: pdf and eps formats.
- Helps troubleshoot resolution issues—measures actual resolution of output.
If there is sufficient interest I will get an example for a future column.
Other organizations can do this for you, but perhaps not as easily or as cost effectively.
Printing expert Dene Taylor, PhD, founded Specialty Papers & Films Inc. (SPF-Inc.), New Hope, PA, in 2000 for clients seeking consultation for technical management, new product design, development, commercialization, and distribution, as well as locating/managing outsourced manufacturing. Contact him at 215-862-9434; This email address is being protected from spambots. You need JavaScript enabled to view it.; www.spf-inc.com.


