Critical Trends in the Converting Industry
- Published: March 31, 2006, By PFFC staff
Special Report
To view this special report as a PDF, click the link below:
The following comprehensive report is something you’ve never seen assembled in one place until now. It is a project PFFC’s publishing and editorial staffs believe has been needed for a long time in our very horizontal industry. Traditionally, several associations have provided snapshots of the industries they individually represent with their own state-of-the industry reports, but no one to our knowledge has queried across the breadth of the converting industry to determine and identify its health and critical trends—until now.
This report is something we hope to feature as part of PFFC’s annual coverage. Hopefully, as our subscribers recognize the value it will bring them in determining where their companies fit within the scope of respondents to our annual survey, PFFC will grow its response rate to reflect an even more accurate picture of our dynamic industry on a collective basis.
This first-time effort provides insight into the changing converting industry as it presently stands, and succeeding versions of the annual survey will track areas of further critical concern as they arise with your input. Please contact me directly with any suggestions or ideas you feel may make this annual effort even more valuable in the future.
—Yolanda Simonsis, Associate Publisher/Editor
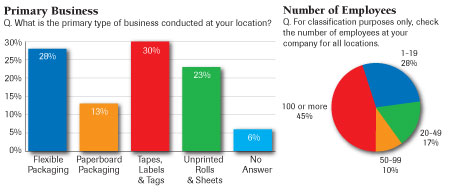
Each primary business type is well represented in the sample
Respondents working primarily in paperboard packaging comprised the smallest subgroup (13%). Respondents tend to work for either the largest or the smallest companies.
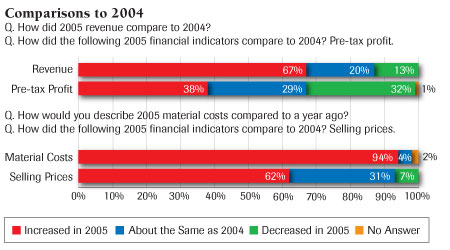
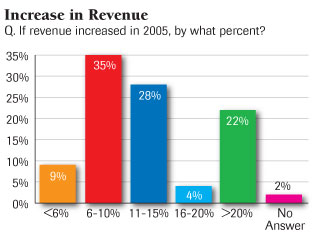
Revenue increased from 2004 to 2005 for most respondents
Virtually all respondents (94%) experienced an increase in materials costs, but less than two-thirds (62%) increased selling prices. Therefore, pre-tax profit increased for less than four in ten respondents (38%) and decreased for nearly one-third (32%). In fact, respondents’ customers’ businesses experienced similar patterns of revenue and profit, with 38% reporting their customers had increased revenue and profit in 2005, while 33% reported their customers showed increased revenue with flat or lower profit.
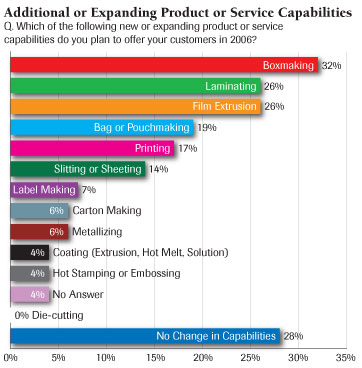
Two-thirds of respondents plan to add or expand their product and/or service capabilities
The top three capabilities likely to be added or expanded are boxmaking, laminating, and film extrusion.
Two-thirds (68%) plan to make at least one significant capital investment over the next six months (defined as an investment exceeding $30,000).
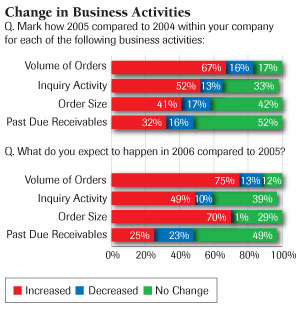
Two-thirds of respondents showed an increase in the volume of orders in 2005, and even more expect growth in 2006
Order volume increased for 67% of respondents in 2005, and 75% expect an increase in 2006.
Many more respondents expect 2006 order size to increase over 2005 (70%) than experienced a 2005 increase (41%).
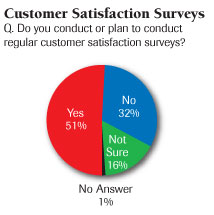
Half of respondents survey customers
A majority of respondents conduct or plan to conduct regular customer satisfaction surveys (51%).
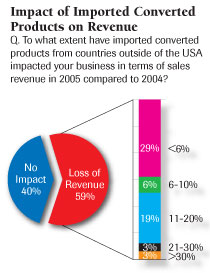
A majority of respondents have experienced a revenue impact as a result of imported converted products
Nearly one-third of respondents (29%) report a 1%–5% loss of revenue, while another 19% report a 6%–10% loss. Four in ten respondents reported no impact.
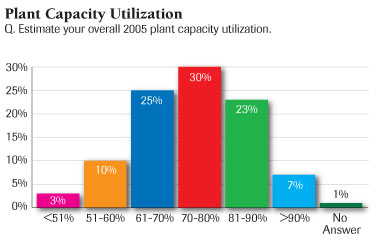
Overall plant capacity utilization was an estimated mean 73% in 2005
Business backlog (defined as orders in-house that will be produced in the next six months) increased for more than half of all respondents (54%), 25% reported no change, and 20% reported a decrease.
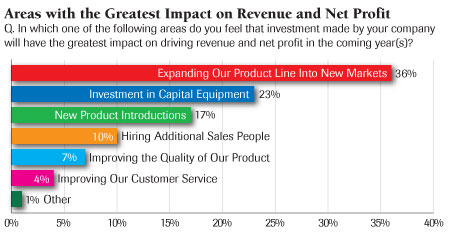
Expanding the product line into new markets is considered the best investment of company resources
Investment in capital equipment (23%) also is considered a wise investment.

Revenue increases averaged 12%, while materials costs increased an average 6%
The largest group of respondents with revenue growth experienced increases of 6%–10% (35%).
Raw materials most often increased 8% or more for respondents with cost increases (46%).
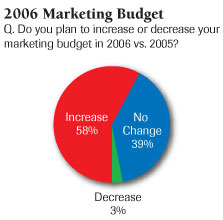
Marketing budgets will increase this year
Six in ten respondents will have a higher 2006 marketing budget than in 2005. While 3% of respondents plan to decrease their marketing budgets, 39% anticipate no change.
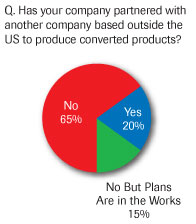
Nearly one-third of respondents now partner or have plans to partner with a company based outside the US to produce converted products
Since more than half of the respondents without current partners or plans to partner did not answer the question about their interests in developing partnerships, it likely can be assumed there is not much interest there.
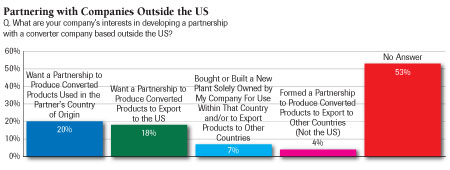
Barely one in five said they want a partnership to produce converted products to be used in the partner’s country of origin (20%) and/or for export to the US (18%).
This e-mail survey was distributed to selected subscribers between February 8 and March 1, 2006, resulting in 69 responses. Complete survey results are available upon request.


